Qubere Command Center
Your entire book of business,
triaged for you before you open a single shipment.
Command Center is one click from Today (the sign-in landing page) — live KPIs, a filing pipeline, a priority-ranked attention list, and per-shipment readiness, all computed off the same rows every other screen reads, not a separate reporting layer that can drift out of sync.
The problem
Ops leads start every morning by clicking into shipments to find out what's on fire.
What a brokerage manager says about the dashboards they have today:
"I have to open a dozen shipments to find the two that are actually about to miss a deadline."
No triage, just a list
"The dashboard number and the shipment-detail number don't always match — now which one do I trust?"
Reporting layer drifts from the truth
"I want to see team workload and value at risk without asking finance to run a report."
No real-time ops view
How Qubere addresses it
One page, ranked by what actually needs a human — not a report you have to interpret.
- KPI tiles, the shipment table, and the priority queue are computed by the same tenant-scoped queries the shipment and filing screens call, live on every load — only the 30-day cycle-time trend line draws from a durable nightly snapshot table, since a true trend needs history a live query can't hold.
- A single attention-priority engine ranks the top 5 shipments that need a human right now, instead of a flat list sorted by date.
- Rolling 30-day metrics — cycle time, exception age, first-pass acceptance — come from durable daily snapshots, so the trend line doesn't reset every time you reload.
- Enterprise-admin roles see team workload and dollar exposure across the whole account.
- Broker decision signals — shipments on hold, past due, unassigned, licenses expiring, screening run on older reference data — are cards that filter the decision queue to exactly the rows they counted; a Recently Decided list shows what was just resolved.
Queue at a glance
Everything that matters, above the fold.
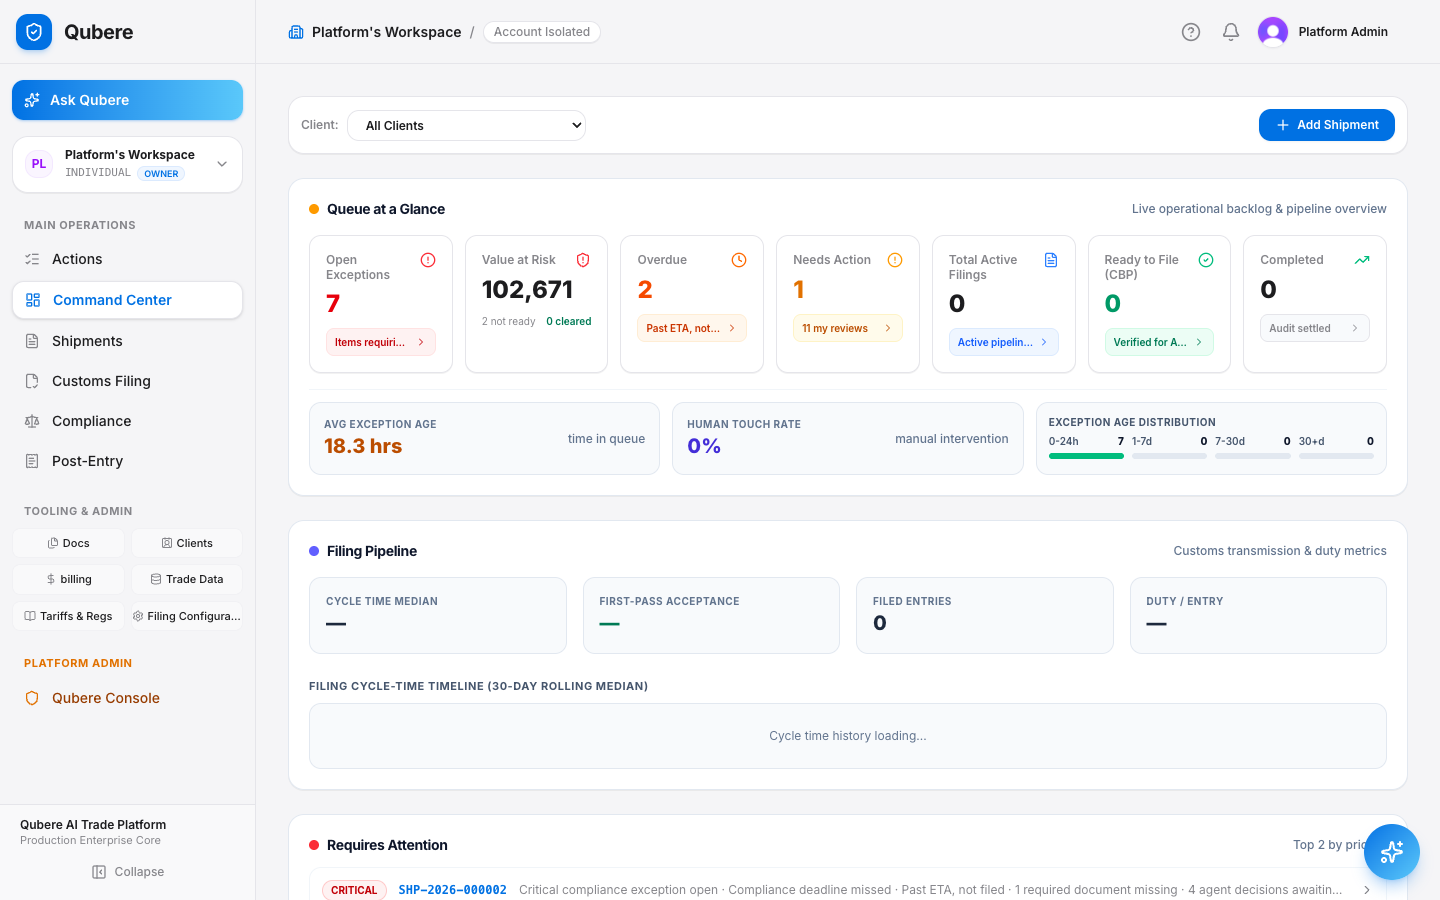
Value at risk, overdue filings, exception age, and AI throughput render as KPI tiles at the top of the page — each one a link into the filtered shipment list behind it, not a static number.
Filing pipeline & priority queue
Not a list sorted by date — a list sorted by what breaks first.
The Filing Pipeline panel surfaces customs transmission & duty metrics — cycle time, first-pass acceptance, filed entries, duty per entry. Below it, "Requires Attention" runs a dedicated deterministic priority engine to surface the top 5 shipments that most need a human, recomputed on every page load.
- Filing Pipeline tiles: Cycle Time Median · First-Pass Acceptance · Filed Entries · Duty / Entry
- Attention ranking weighs critical/blocked/needs-review decisions, overdue status, missing documents, and hours-to-deadline together — not one field sorted alone
| critical | SHP-2026-000007 | Critical exception · missing documents · overdue |
| critical | SHP-2026-000002 | Blocked decision · filing deadline in 4h |
| high | SHP-2026-000144 | Needs-review decision · HTS classification |
Shipment table
Readiness isn't a status label — it's a bar you can see the gap in.
Every row shows a readiness breakdown across documents, classification, and screening — plus extraction quality and reconciliation as supporting signals — computed by the same engine that gates whether a shipment can actually be filed — so the table can never claim "ready" when the filing screen would still block it.
- Capped at 2,000 rows per load with an explicit truncation notice — never a silently incomplete table
- Dedup'd to the latest decision per shipment per agent, so re-runs don't double-count
- A row with an open compliance deadline (ISF, entry filing, duty payment) shows a live countdown chip with hours/days remaining and penalty exposure
| Shipment | Readiness | AI status | Value |
|---|---|---|---|
| SHP-2026-000007 | 28% | blocked | $96,120 |
| SHP-2026-000091 | 72% | in review | $41,880 |
| SHP-2026-000162 | 100% | verified | $18,220 |
Team workload & value at risk
A manager sees the whole book. An analyst sees their own.
Enterprise-admin roles get an account-wide view — open work per team member and total declared value at risk — on the same route a non-admin loads. Today that gating hides the workload panel, value-at-risk tile, and broker column for non-admins; the shipment list itself is account-wide for every role, not yet filtered to a user's own assignments — call this out as a near-term roadmap item rather than a shipped behavior.
- Value at risk = declared value across shipments below the readiness threshold, not a modeled estimate
- Workload counts reflect current assignment, not a historical snapshot
Quality trends
AI throughput and override rates, not a vanity metric.
An expandable section covers AI throughput (auto-certified vs. human-reviewed volume and touch rate), an Agent Operations table per classification agent, and a "My Review Queue" summary — the same shipment and decision data the workbench uses, not a separate reporting layer.
- AI Throughput: auto-certified count, human-reviewed count, touch rate %
- Agent Operations table: Agent · Processed · Review · Blocked · Override rate
| Agent | Processed | Review | Blocked | Override |
|---|---|---|---|---|
| Classification Agent | 198 | 14 | 3 | 6.2% |
| Screening Agent | 114 | 4 | 1 | 1.1% |
Objection handling
Every hard question, answered directly.
| "Is this a BI dashboard bolted on top, pulling from a stale warehouse?" | No — every tile and table calls the same tenant-scoped queries the shipment and filing screens use. There's no separate analytics pipeline to drift out of sync with production data. |
| "What happens with 5,000 open shipments — does the page just hang?" | The shipment table caps at 2,000 rows with an explicit truncation notice rather than silently dropping rows or timing out. KPI aggregates are computed server-side, not client-side over the full row set. |
| "Can an analyst see the whole company's value at risk?" | No — account-wide Team Workload and Value at Risk render only for enterprise-admin roles; non-admins never see those tiles or the broker column. The shipment list itself is still account-wide for every role today, not yet scoped to a user's own assignments — on the near-term roadmap. |
The close
"One click from Today — you're looking at what needs you most."
No setup, no separate reporting tool, no numbers that can drift from the truth — because there's only one truth to compute from.
Next step: log in as a non-admin and as an enterprise admin, load Command Center in each, and show how the workload panel, value-at-risk tile, and broker column appear only for admins.